WLTP vs real-world consumption
How far real consumption drifts from the official figure, why it does, and how to get a number that matches your driving.
Updated September 5, 2026
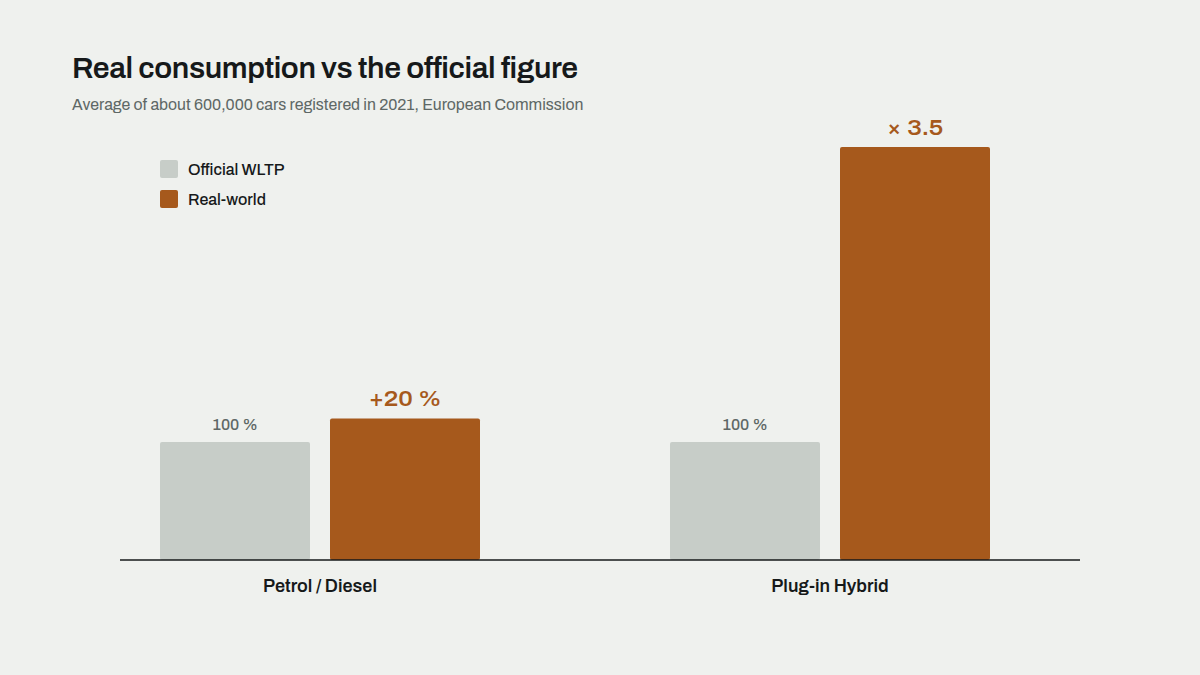
Real consumption is higher than the official WLTP figure for almost every car. According to the European Commission's first report on data recorded by cars themselves, petrol and diesel cars used on average about 20% more fuel than their WLTP value, and plug-in hybrids about three and a half times more. The gap is not a scandal and it is not random: it comes from a test that is deliberately mild, and it is predictable enough to plan around.
It also helps to remember where WLTP came from. The NEDC cycle it replaced in 2017 and 2018 was far off: short, slow and gentle, with figures that hardly any driver could match, and the gap between brochure and pump kept growing for years. WLTP is longer, faster and closer to how people drive, and its figures are reachable in normal, unhurried driving. It remains the only standardised measurement every new car in Europe goes through, which makes it the best basis for comparing cars with each other, even when your own number ends up a little higher.
Where the real numbers come from
Since 2021 every new car in the EU records its own fuel or energy use with an on-board fuel consumption monitor. The Commission collected that data from about 600,000 cars registered in 2021 and compared it with the WLTP figures those cars were sold with. That is the first time the official gap has been measured at scale rather than estimated, and this site's advice is calibrated to it.
Why the gap exists
WLTP runs at 23 °C, with the air conditioning off, on a flat roller, with standard tyres and a patient driver. Real driving differs in ways that all point the same direction:
- Speed. The test's motorway phase peaks at 131 km/h but spends little time there. Sustained 130 km/h uses far more than the combined figure suggests, because air resistance grows with the square of speed.
- Temperature. Cold engines, cold batteries and heating all cost energy. Electric cars lose the most in winter.
- Load. Passengers, luggage, a roof box or a trailer add weight and drag the test never sees.
- Driving style. Hard acceleration and late braking throw away energy that the test's gentle trace conserves.
- Equipment and tyres. Wider wheels and options fitted after homologation are not in the figure.
Your own gap depends mostly on your motorway share. A city driver can land close to or even below the WLTP figure; a motorway commuter will be well above it.
Where each kind of car stands
| Car type | Official vs real, on average | Note |
|---|---|---|
| Petrol and diesel | About 20% more in real use | Larger on the motorway, smaller in town |
| Electric | Higher in winter, close in mild weather | Range drops most with cold and speed |
| Plug-in hybrid | About 3.5 times the official figure | The official figure assumes frequent charging |
Plug-in hybrids: the special case
The official figure for a plug-in hybrid, typically around 1.6 to 1.7 l/100 km, blends an electric-only test with a battery-empty test using an assumed share of electric driving. Real drivers charged far less than that assumption, so the Commission found real consumption around 5.9 l/100 km. From 2025 the EU lowered the assumed electric share, so official plug-in figures rise without any change to the car; a car rated at 1.3 l/100 km can show about 2.5, with a further step in 2027.
This site sidesteps the assumption. Plug-in hybrids are shown with their fuel consumption with the battery empty, the figure you get when you do not plug in, and the compare tool blends in your own charging based on your trips. The guide Is a plug-in hybrid worth it? works through when that blend comes out in your favour.
How to get closer to your own number
- Use the phase figures, not the combined one. Every car page shows city, suburban, country road and motorway separately.
- Weight them by how you actually drive. If 60% of your kilometres are motorway, the motorway figure should carry 60% of the weight. The compare tool does this with a driving profile.
- Add a margin for weather and load. Ten to twenty percent on top is realistic for most drivers.
- Compare cars, not against a fixed target. The gap is similar for cars of the same type, so a car that is 0.8 l/100 km better in WLTP will usually be about that much better on the road.
Check it for your car
Open any car page, for example the VW Golf 1.0 eTSI DSG, to see its four phase figures. Add it and a rival to the compare tool, set your yearly distance and prices, and read the bill. The rankings show which cars start from the lowest official figure in each class.