What is WLTP?
The lab test behind every official consumption figure in the EU: its four phases, its conditions and what it cannot tell you.
Updated September 5, 2026
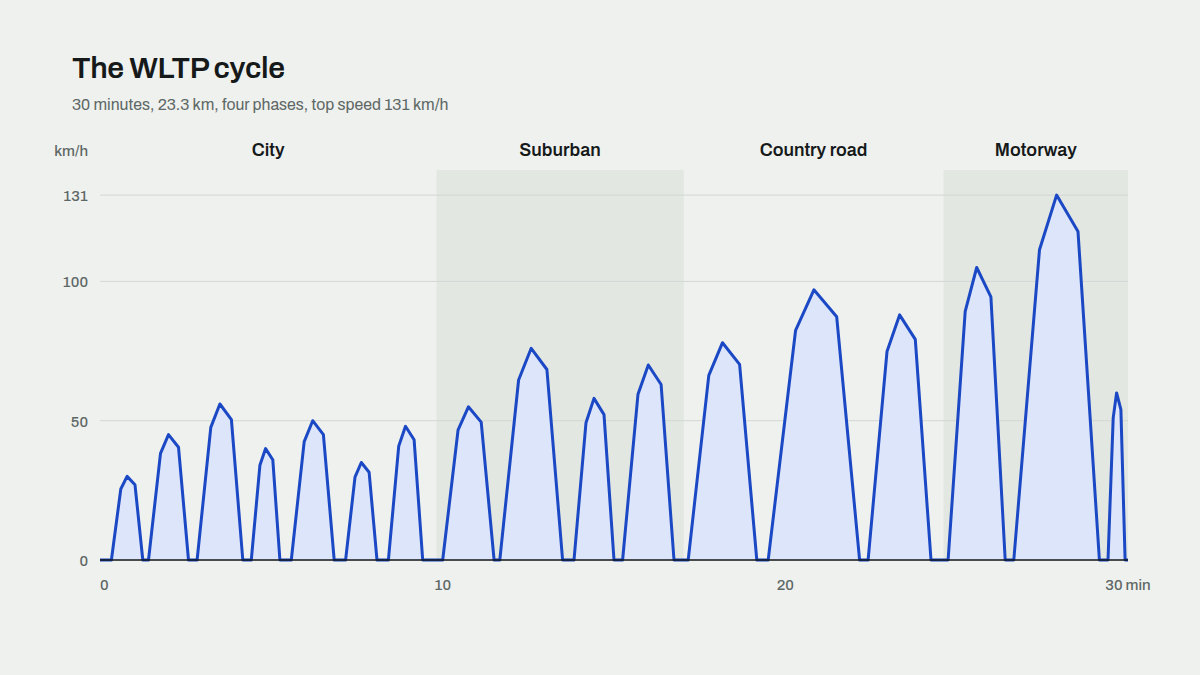
WLTP is the Worldwide harmonised Light vehicles Test Procedure, the laboratory test every new car sold in the EU has to pass before it gets an official fuel consumption, CO2 and, for electric cars, energy consumption and range figure. Every number on this site comes from it. It replaced the older NEDC test for new car types on 1 September 2017 and for all new registrations on 1 September 2018, and it is the reason two brochures from different brands can be compared at all: the same car, the same room, the same script.
Where the figure on the label comes from
The car is strapped to a chassis dynamometer, a set of rollers that lets it drive without moving, in a room held at 23 °C. A driver follows a fixed speed trace on a screen for about 30 minutes and 23.3 km. Fuel used, CO2 emitted and, for electric cars, energy drawn from the battery are measured over that run. The result is the "combined" figure, plus one value for each of the four phases of the trace.
Because optional equipment changes weight and aerodynamics, a model is tested in more than one configuration, which is why one model can carry several official values. That is also why this site lists variants, not just models: the figure belongs to a specific engine, gearbox and body combination.
The cycle: four phases
WLTP splits its 30 minutes into four speed ranges. This site labels them by the kind of road they stand for.
| Phase | Label on this site | Stands for |
|---|---|---|
| Low | City | Stop-and-go traffic, frequent idling |
| Medium | Suburban | Steady urban driving with fewer stops |
| High | Country road | Rural roads up to about 100 km/h |
| Extra high | Motorway | Sustained speed, up to 131 km/h |
The average speed across the whole trace is about 46.5 km/h and the top speed is 131 km/h. The phase figures matter more than the combined one: a car that drinks in the city but sips on the motorway will suit a commuter differently from someone who only crosses town.
What WLTP measures for each kind of car
For petrol, diesel and conventional hybrid cars the result is fuel consumption in litres per 100 km, per phase and combined, and CO2 in grams per kilometre.
For electric cars it is energy consumption in kilowatt-hours per 100 km and the electric range in kilometres, measured until the battery is depleted on the same cycle.
Plug-in hybrids get two tests. One starts with a full battery and runs the cycle repeatedly until the battery is empty (charge-depleting). The other runs with the battery empty (charge-sustaining), which is the car behaving as a petrol car with extra weight. The official combined figure blends the two with an assumed share of electric driving called the utility factor. This site shows the charge-sustaining fuel figure for plug-ins, labelled "battery empty", because it is the only one that does not depend on an assumption about how often you charge. The compare tool blends in your own charging habits instead.
What WLTP cannot tell you
It is a lab test, and the lab is kind. The room is warm, the air conditioning is off, the road is flat, the tyres are the standard ones, and the driver never rushes. Real driving is colder or hotter, faster on the motorway, heavier with passengers and luggage, and less patient. According to the European Commission's first report on real-world data recorded by cars themselves, petrol and diesel cars used on average about 20% more than their WLTP figure. The gap for plug-in hybrids was much larger. The guide on WLTP vs real-world consumption goes through the reasons and what to do about them.
WLTP also says nothing about cost. Turning litres or kilowatt-hours into euros needs a price and a yearly distance, and that is what the compare tool is for.
Check it for your car
Every car page on this site shows all four phases and the combined figure, for example the VW Golf 1.0 eTSI DSG. The rankings list the most economical cars by body type and fuel. And the compare tool turns the figures of any cars you pick into a yearly bill for the way you drive.